Using the Avalanche Explorer Tool
Avalanche activity often follows patterns where similar avalanches release on similar slopes. You can use the Avalanche Explorer to look for these patterns. Then use the data to help you avoid slopes that could produce a similar avalanche.
You can learn more about avalanche data codes on our Avalanche Coding help page or in Chapter 3 of Snow, Weather, and Avalanches: Observation Guidelines for Avalanche Programs in the United States.
How to use the tool
Filtering
- Use the dropdown menus at the top of the page to the right of the map
- Click on the bars and pie pieces of the charts in the right-side panel. Look for the reset link in the upper right on the charts where you’ve set a filter. You’ll see just the filtered records on the map.
- Use the lasso tool on the map to select an area or group of data points. You’ll see data from just those points in the charts on the right. Click on the X to clear your lasso selection.
- You can sort the records in the tables by clicking on the column headers
Help
- Mouseover areas of the charts to see numbers or get some help (don't mouseover the chart labels)
- Mouseover labels in the table to get some help
Colors
- Avalanche Trigger - Map, Pie Chart, Table
- Red - Avalanches triggered by people - This includes avalanches triggered by skiers, snowboarders, snowmobilers, snowshoers, hikers, and climbers.
- Blue - Avalanches triggered by explosives - These are slides triggered as part of active avalanche hazard mitigation programs.
- Green - Avalanches triggered by natural events such as snow and wind storms
- Purple - Other and Unknown - This includes avalanches triggered by vehicles, wildlife, or if we are not able to determine the cause of the avalanche.
- Clusters - Map
- Orange - Shows clusters of avalanches with the same location. Click orange circle to expand the cluster. Click anywhere else on the map to close the cluster.
Video Tutorial
CAIC Avalanche Explorer Help
Explorer Elements
Map - The location of each avalanche
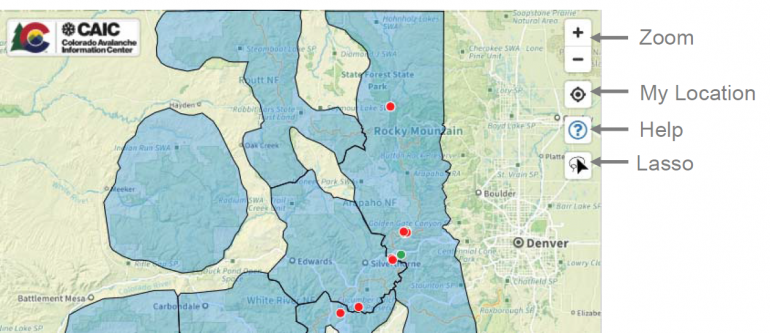
Top menus - Filter the data by
- Date range
- Observation type
- Avalanche type
Zone bar chart - The number of avalanches in each forecast zone
- Click on one or more bars to filter the data
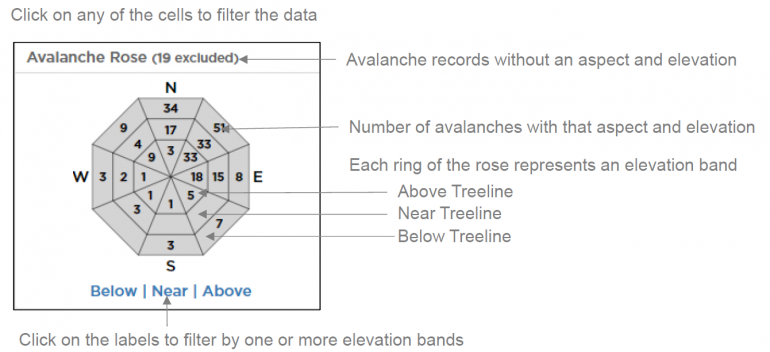
Avalanche Rose - The number of avalanches on slopes that face different directions and in different elevation bands
- Click on a cell, or multiple cells, to filter the data for specific aspects and elevations
- Click on the labels at the bottom, and the vertical lines between them, to filter the data by elevation band
- Click on the cardinal direction letter (N,E,S,W) to filter by cardinal direction
Trigger pie chart - The number of avalanches in each trigger category
- Click on one or more sections to filter the data
Size pie chart - The number of avalanches in each size category
- D stands for Destructive size - 5 categories based on the destructive potential of the avalanche
- R stands for Relative size - 5 categories based on the size of the avalanche relative to what the avalanche path could produce
- Click on one or more sections to filter the data
Avalanche Table - A list of filtered records
- Click the balloon icon to find the avalanche on the map
- Click the popup window icon see more details
- Click the header of each column to sort the avalanches in ascending or descending order
Destructive Size Count by Date bar chart - The number of avalanches by D size each day
- Mouseover the D size categories on the y-axis to highlight avalanches of a particular Destructive size
- Click on bar for to filter by day(s)
What to Look For
Location - The drainage, mountain range, forecast zone, or region where the avalanches are releasing
- Tip: Look for avalanche activity that is near the place you want to go. How close does an avalanche have to be to be important? It depends. A soft-slab avalanche cycle (Storm and Wind Slab avalanches) might cover a single drainage or mountain range. A hard-slab avalanche cycle (very large Persistent and Deep Persistent Slab avalanches) might cover a much larger region like all of the Northern Mountains.
- Tools
- Zone bar graph
- Map lasso tool
Aspect - The compass direction the avalanche start zone slope faces
- Tip: We record avalanches by the eight cardinal compass directions (N, NE, E, etc…). There can be some interpretation in how this value is selected for a specific avalanche. Wide avalanches can release in bowls or cirques that face multiple directions. CAIC forecasters will pick a direction for observations that don’t include one. Aspect is an extremely important parameter, but you should think about how the snow is changing through the terrain and don’t get too focused on the specific value.
- Tools
- Avalanche Rose
- Map
Elevation - We group avalanches into three bands: Below Treeline, Near Treeline, and Above Treeline
- Tip: The three elevation bands are not fixed values. They could be at a different elevation in a different part of the state. They are slope and vegetation characteristics that impact the collection, distribution, and structural elements of the snowpack.
- Tools
- Avalanche Rose
- Map